


Navigating the RP Wasteland in Sorare MLB
Playing whack-a-mole in a sea of same-ness.


I’m gonna be honest here, I have started, stopped, and rewritten this article a number of times.
RP is one of the toughest positions to manage in the game of Sorare MLB.
It follows then, that writing about optimal strategies for setting that roster slot is… difficult.
Difficult, but not impossible.
What follows is my attempt at scientifically (mathematically?) dissecting the RP position to create a clear strategy for maximizing each game week.
The Problem.
Or, as a former co-worker of mine might have said, “the Opportunity” here is to improve upon the feeling of whack-a-mole when it comes to selecting a player for your RP slot.
Sometimes this is easy, for example if you are deciding between a reliever who has 4 games and one that has 2, there is an overwhelming advantage to choosing the one with 4.
But we won’t deal with that today.
No low hanging fruit for us.
Similarly, if you are one of the lucky few who owns a Spencer Strider RP-eligible card, and he has a tasty matchup on the week, you don’t need me to tell you to start him.
Again, no low hanging fruit for us today.
But what about when all teams are on 3 game weeks, and you are trying to choose between 3 different Closers? Or a mediocre closer and a guy that might get you a Hold?
That’s the good stuff.
That’s where, if we can just be “right” a little more often using some set strategy, it could be the difference between winning a reward and going home disappointed.
Heck, with how Saves and Holds sometimes cluster, it could mean the difference between netting a high tier reward vs. a mid-tier one.
This matters, even if it is no fun to think about.
The Process.
I mentioned my pseudo-scientific method above, let’s see what that means in practice.
First, I pulled the YTD scoring for relievers from Fangraphs.
Next, I translated that into Sorare points, for trendspotting.
This helped determine who is simply scoring the most points. My suspicion is that this is where most people stop with their analysis.
Looking at the market prices for the top YTD scoring relievers all but confirms this.
But it isn’t super helpful beyond telling you that Closers score the most points, and Holds guys score second most. YTD points offer little clarity on when these points are scored.
If we were playing a season-long game, that might be where this analysis would end, but we play a game dictated in 3 and 4 day increments, so we need more.
Here’s part two of the analysis process:
I grabbed 7 days worth of game data (manually) off CBS Sports - recording:
The betting line (who was favored and by how much)
Who won (whether it was the favored team or the underdog)
Whether there was a save opportunity in the game
Once gathered, I recorded an outcome for each game. One of 4 things happened:
The conditions were met for a save and the favored team won
The conditions were not met for a save and the favored team won
The conditions were met for a save and the underdog won
The conditions were not met for a save and the underdog won
Note: just because the conditions were met for a save does not mean one was recorded. Baseball is finnicky like that.
Going through this process yielded 102 datapoints (games) which I deemed sufficient as a first wave of research. However, repeating this process on a larger dataset could serve to strengthen or disprove the conclusions to come.
The Takeaways
There is a point I am getting to, I promise. This isn’t Austin Powers.
Small sample size aside we can draw two major conclusions from our two areas of focus.
First, from the Fangraphs side, we see that the RPs that have scored the most points are, somewhat unsurprisingly, in the Closer Role for teams that have won a lot thus far. I also dropped in Spencer Strider just to show he’s no longer the cheat code he once was, but still great.
Here is the top 10, by YTD points as of yesterday:

Not a lot of surprises here.
The surprise factor only begins to heat up when we get to Alvarado, Robertson, and Estevez. Alvarado might not be a household name yet, but he’s pitched amazingly, and Robertson has filled in well for Edwin Diaz thus far. That leaves Estevez as the shocker for 10th place.
As mentioned before though, YTD stats are only part of the battle though - some of these closers earn massive chunks of their stats in single GWs, then don’t appear at all in the next week.
Queue my mental image of the game whack-a-mole.
Enter my (albeit preliminary) Vegas odds analysis, which is summed up pretty well in the chart below:

Within this 102 game sample observed, roughly 38% of contests ended where a team was favored, won, and qualified for a save chance. Then there were another 28% of games where the favored team won, but there were no saves to be had in the contest. This comes out to 66% of the time the team favored by Vegas was the team that emerged victorious.
Interesting, but let’s go a layer deeper.
As Hunter and I discussed on our show a few weeks back, my theory was that you wanted to roster closers that were expected to be in close matchups for a game week, hopefully putting yourself in a position for more save chances.
This is where those Vegas lines earn their keep a second time. Taking the average of the lines for each major bucket yielded potentially helpful results.
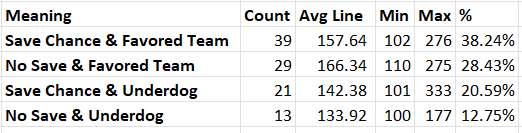
We see that our optimal scenario - earning a save chance and being the favored team - carried an average line of 157.64 (or -158 if you are used to looking at lines).
Conversely, the no-save chance scenario where the favored team still wins had an average of 166.34, almost 10 points higher. In a dataset this small and noisy, I find myself wishing that 10 point gap told a stronger story, but it is at least the glimmer of an edge.
This is where I will say again that more data would be exceptional in adding confidence to this model, but at least have early support for my hunch.
Putting it all Together
Great Nick, stats are neat, but what does this mean for me each week?
If we put everything together from the analysis above, one “dominant” strategy appears to rise above the rest, provided you have the depth and budget for it.
For maximum impact, you will want to target Closers on teams who are favored in all of their games for the Game Week - with the caveat that lower lines are preferrable to higher.
For example, if for some reason you have two elite closers to decide between, and one has 3 games where his team is favored with a -125 line, while the other has 3 games at -250, I’ll be targeting the -125 guy. However - Based on the stats, I would rather have the -250 guy over a closer with elite stuff who is NOT favored over the weekend.
This will take more analysis in the months to come, but if I were making RP tiers to help guide decision making, the TLDR would look something like this:
4 Game Week:
Elite Tier
Closers - favored, but not too much
Spencer Strider in a great matchup
Great Tier
Closers - Heavily Favored
Closers - Slight Underdogs
Holds Guys - favored, but not too much
Solid Tier
Holds Guys - Heavily Favored
Holds Guys - Slight Underdogs
Closers - Heavy Underdogs
Fill-in and Stopgap Tier
Holds Guys - Heavy Underdogs
Middle Relievers
Where this all gets fun is when you have a middle reliever in a 4+ game week compared to a Slight Underdog closer in a 3 game week. That is where the artist in you will need shine. It also might be the subject of future iterations on this theory.
For now, this is the closest thing to a data-driven edge to RP selection that I can concoct - may it serve you well in the months to come.
Thank you all for reading, please let me know your thoughts on Twitter or here in the comments!
If you found value here, consider sharing this post with a friend using the button below. I recently switched this newsletter into high gear, and am looking to help as many Sorare MLB players find their edge as is humanly possible!
Cheers mates!