


Sorare MLB - How Efficient is the Market So Far?
Spoiler Alert: Not very. Let's dig into why!


We’ve been playing Sorare MLB for a little over a month now, and have ridden the highs of launch into the opening of all the main tiers of competition.
During this time I, like many of you, have spent more time than I care to admit browsing player cards, ranks, and prices to try and build out the best roster possible while staying on a tight budget.
It quickly became evident that many of my player values do not match up to the cost of acquisition. For some collectors, this may not matter at all. For those looking to win on a budget, this realization presents an opportunity.
I began to develop a hypothesis that player prices could be modeled to help guide buy-low or sell-high decisions, from a fantasy perspective.
The Process
I began by digging into my data-analysis roots. I’d already built out a custom player ranking model that guides the fantasy side of my decision-making. The unique part of Sorare MLB, as you well know, is that there is a real cost of roster moves, which represents the second major facet of playing the game effectively.
I don’t yet have a formal query system set up to pull the player pricing data in an automated fashion. This is on the future backlog. If you, dear reader, have any pointers on how to pull that data at scale, I am all ears. For now, I went at it the old-fashioned way: one at a time on the wonderful platform that is SorareData. That being the case, the graphs we will dig into in a sec are dated by a few days.
Once I had my ranks and the 3-day player average cost side-by-side. In doing so I was able to flesh out some graphs to predict what a card price “should” be if we throw out that there are factors outside of fantasy rank that also play a role in determining value. This is a collecting game after all, so card-buyers can have multiple motivations to buy. I look at all this from a highly performance-focused angle and try to be as agnostic toward “name value” as possible.
The Result
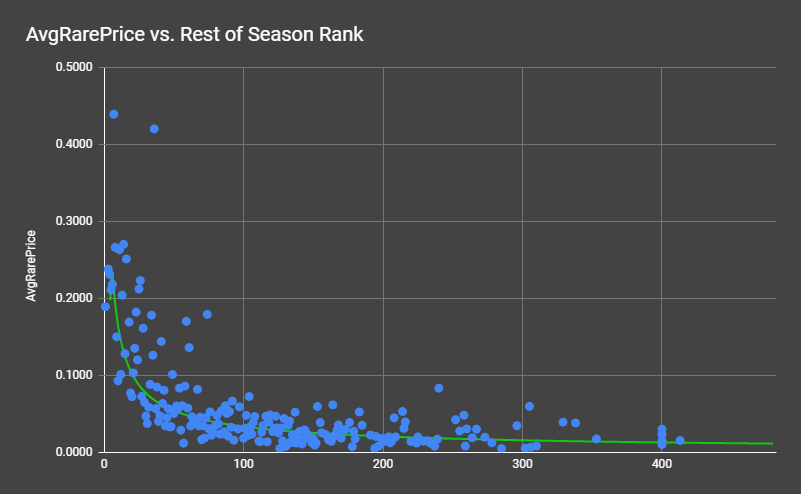
I want to run through two graphs with you, then discuss what they mean. The first is the redraft player ranks for the rest of the year plotted against the price. The ranking data is simply pulled from FantasyPros which is a great service to find good, aggregated, fantasy info.
The second graph represents my custom ranks - a hybrid of redraft (this season), dynasty (long-term) ranks, and my own personal adjustments - plotted against player cost.

A couple of things immediately jump out to me. First, neither dataset is what I would call efficient, but they are close and follow a roughly exponential trend. Second, using redraft ranks produces a much tighter chart than my ranks.
What does this mean?
Put simply, the fantasy rank of a player right now is more predictive of their price than the fantasy rank of a player over a longer time horizon. This is rough though, as you can see, with many players falling well above or well below the trendline.
A quick aside - do you want to know where your favorite player falls on this chart? Feel free to hit me up in the comments and I will happily share some value-intel.
Key Takeaways
Overall, thinking about these two graphs yields a few interesting ideas:
First, both models follow essentially an exponential curve. This means that the top players in the game are exponentially more valuable than middling players.
Second, related to this, the price graph evens out rather quickly. Once the curves clear the top 50 players, values (cost) don’t change as much as expected productivity does. This means that you can capitalize on this intel and focus on players at the upper end of this range to accumulate great players without breaking the bank.
Third, A long-term mindset can be your friend when buying cards today. If prices roughly follow the trend of value now, and you buy your players with an eye on now and later, then you are maximizing your chances to compete for both this season and beyond. You are also buying players that are more likely to appreciate over time. On top of this, there are clear outliers that give even more chances at appreciation. These are the players that fall under the green prediction line. This concept is, of course, entirely contingent upon how long you plan to play the game. The longer you want to play, the longer the time horizon you should use when buying players today.
Fourth, these graphs are limited to what has already happened, so just because this conclusion is potentially true (read: predictive) today does not mean it will be true tomorrow or next year. Fantasy value is just as fluid as card price, so you will need to stay just as fluid in your assessments moving forward. As will I.
Lastly, as prices and ranks change, and as time goes on, I plan to continue refining this model to guide buying players that are well below where they should be in terms of price, and sell when players that are well above their predicted price. Sounds simple, of course, but in practice, this will prove much more difficult. Properly timing any market is extremely difficult, after all.
Final Conclusions
We are not dealing with a fully efficient market in Sorare MLB. At least not yet. Some players are wildly underpriced, and others carry substantial premiums.
Savvy owners can attempt to live in these value gaps and compete for both today and tomorrow while maximizing the runway of their ETH/USDC budget.
The key here is being patient, staying flexible, and vigilantly watching as ranks and prices fluctuate. Plus you have me to guide you, so there is that.
If what I am writing resonates with you, please subscribe, share it with a friend, and consider following me on Twitter. ⚾
If you use my referral link here to join Sorare and start competing, we will both receive a free limited card! Who doesn’t like free stuff?
*Disclaimer: The above advice is meant to inspire strategic thinking about SorareMLB, the fantasy baseball game, and is not intended to be taken as financial advice. Before making any decision involving your hard-earned money, please be sure to do your own research and not spend more than you can afford to lose.*